Tableau Dashboard
SQL / Data Storytelling / Business Intelligence
📌 Overview
A multi-page Tableau dashboard for trend and KPI analysis, designed to provide insights on product sales and regional performance.
This data visualization project presents a comprehensive interactive dashboard analyzing key trends from the 2024 Paris Olympics. Built using Tableau, the dashboard explores medal distribution, gender breakdowns, and daily Olympic schedules. It transforms complex datasets into digestible visuals that answer core questions such as:
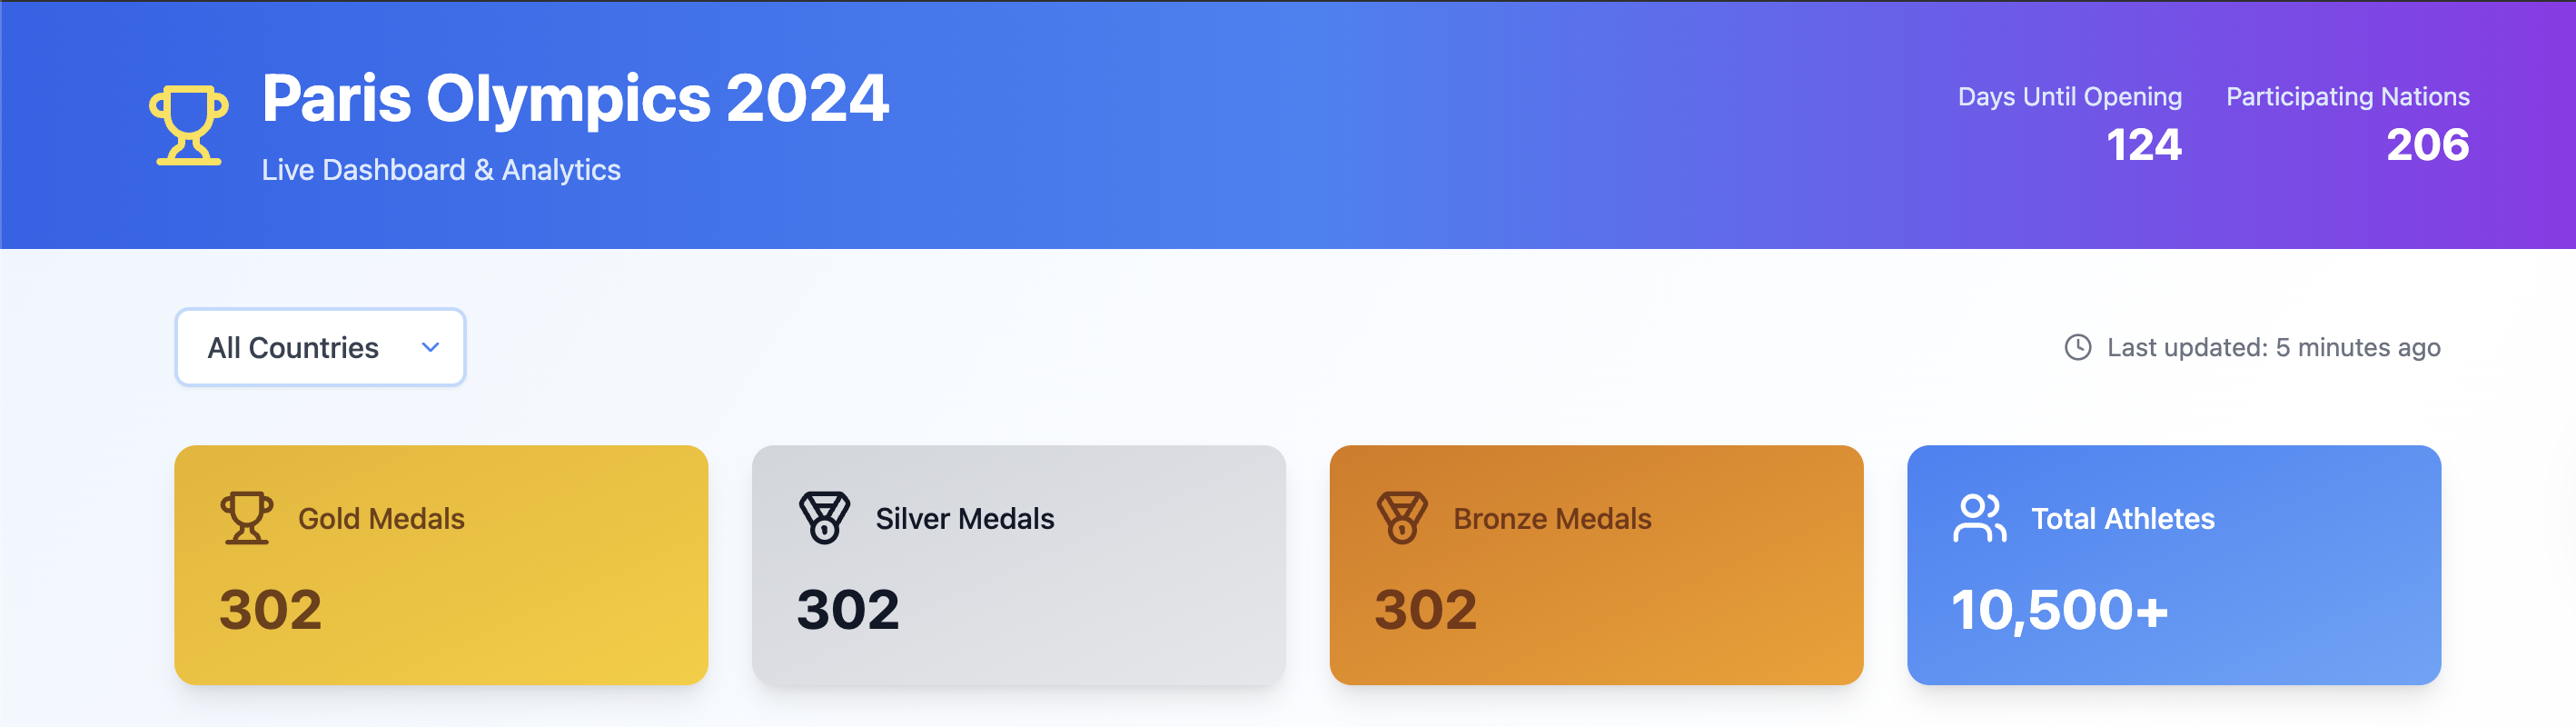
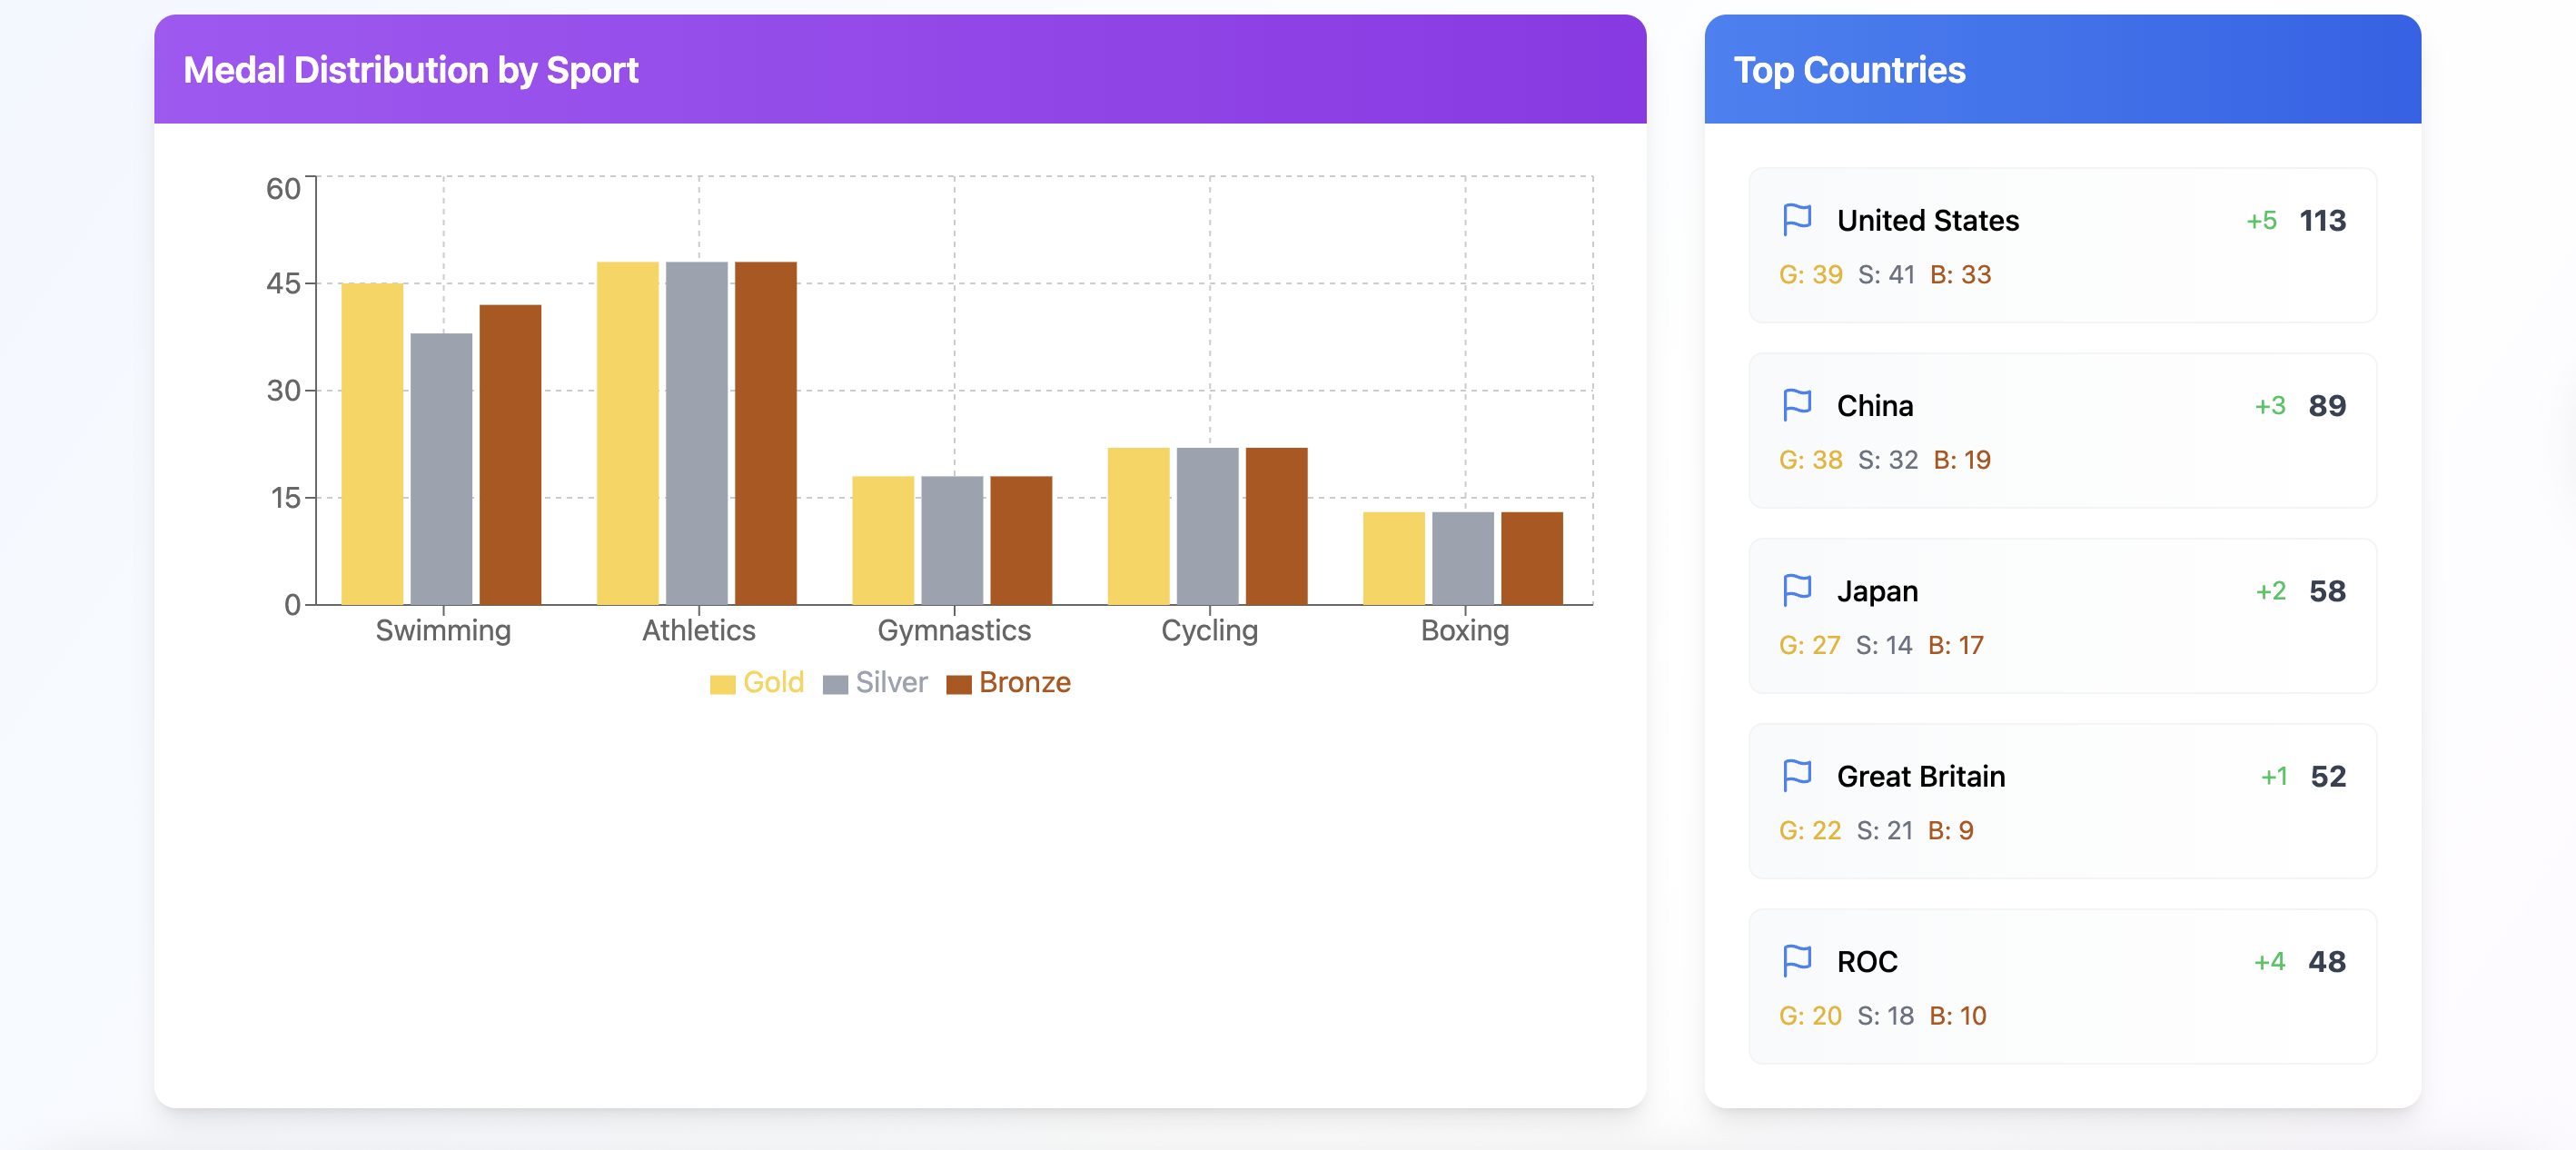
- Which countries lead in medal count?
- How does performance vary by gender and sport?
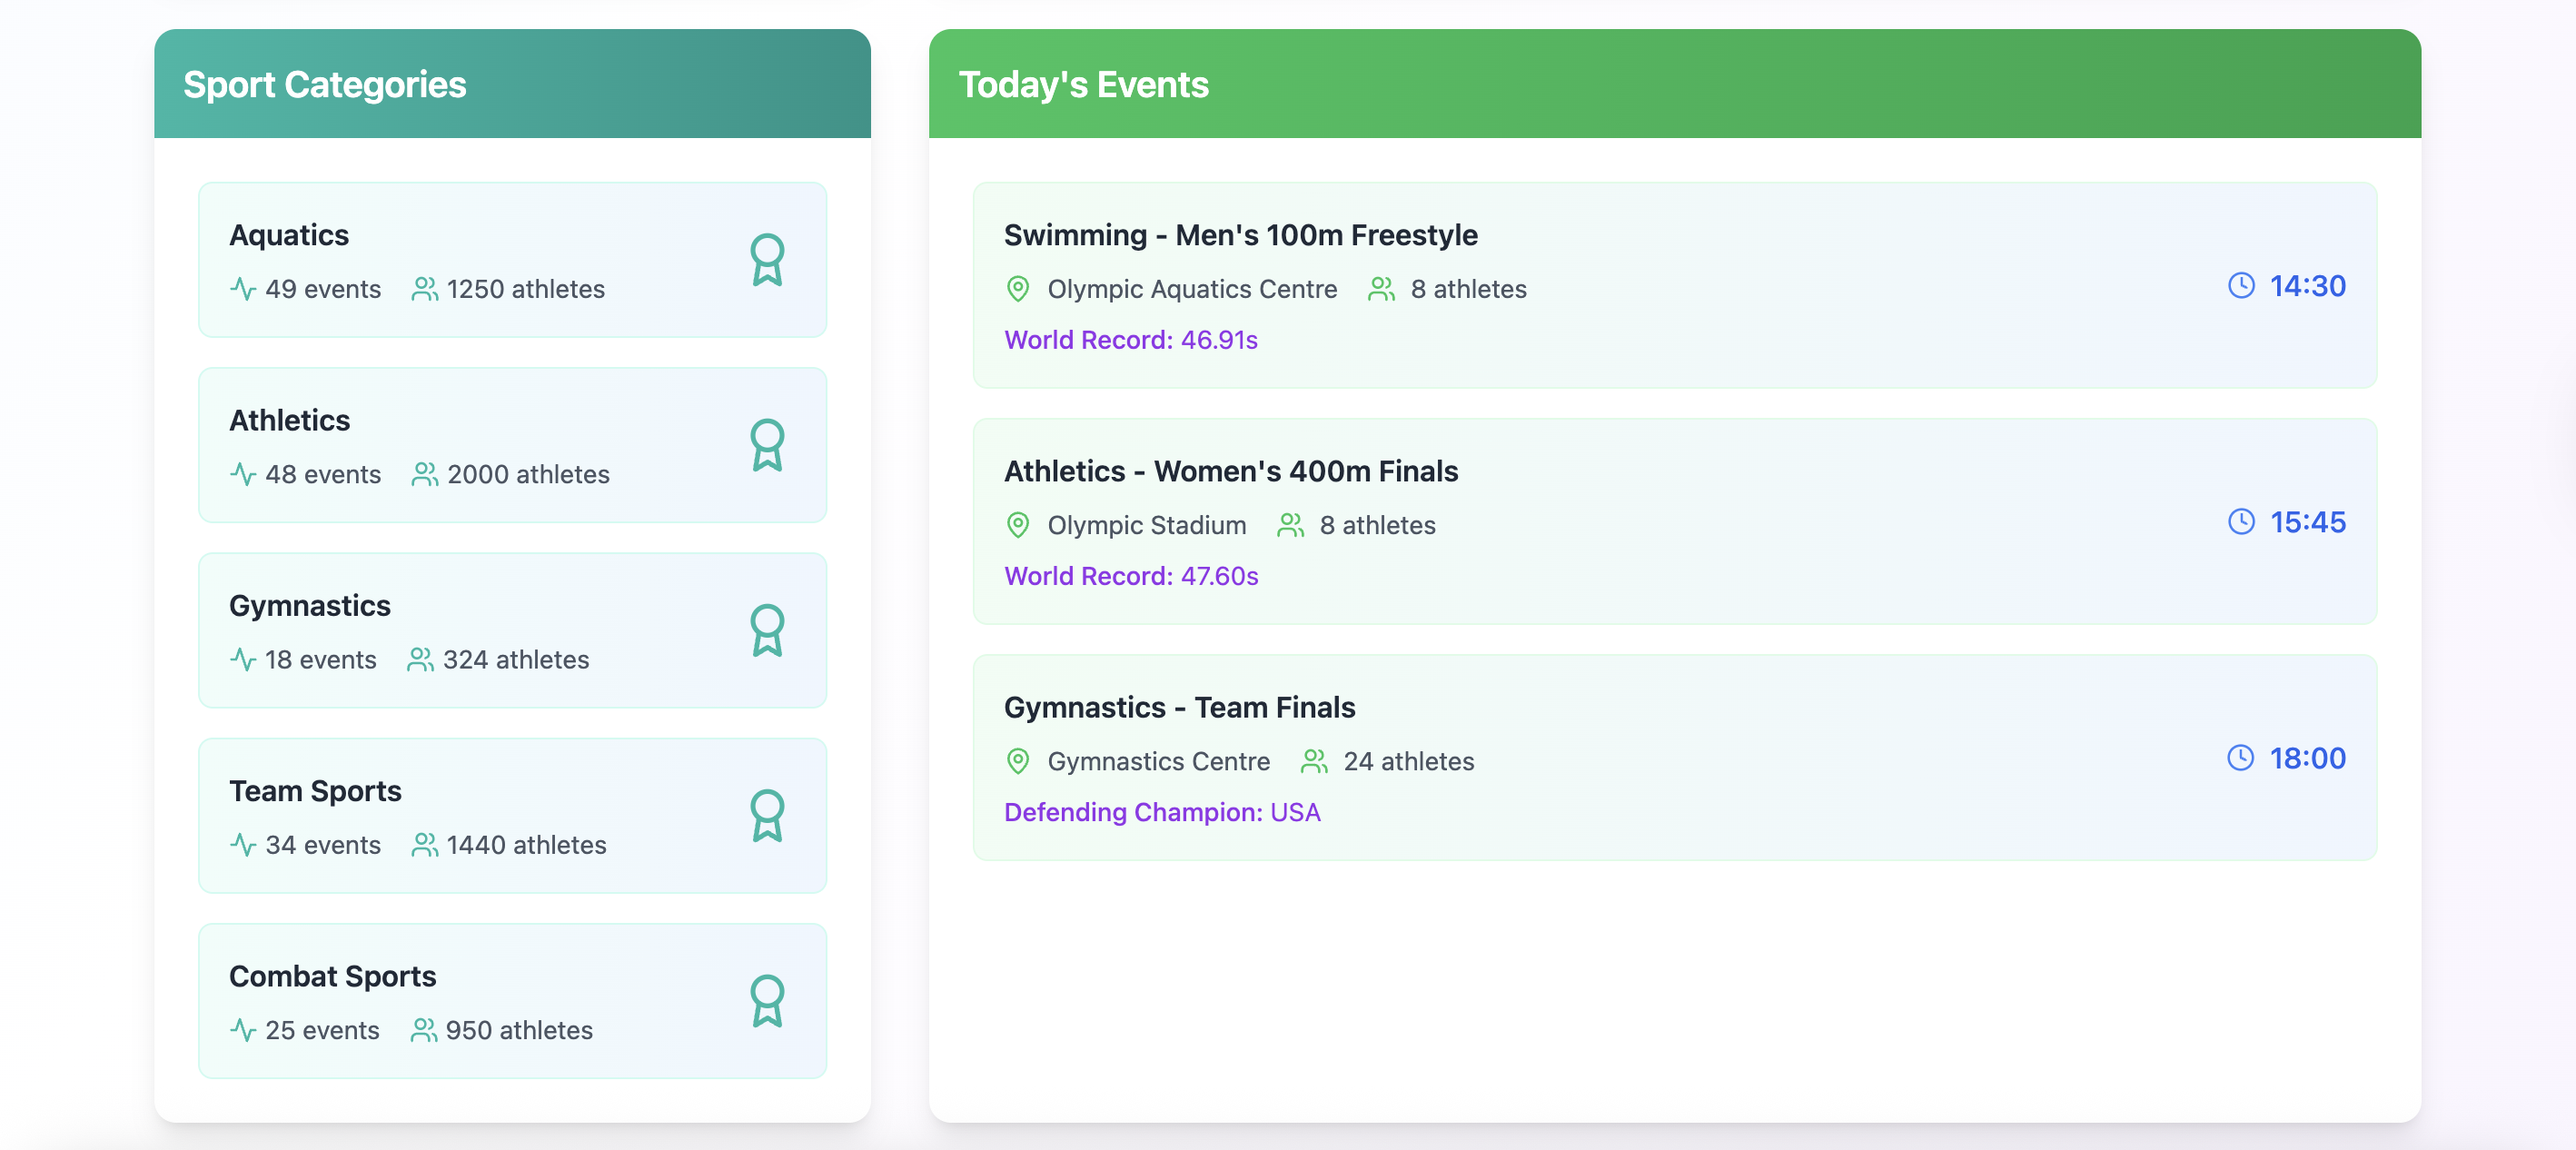
- What are the peak and least active days during the games?
Data was sourced from multiple structured CSVs (athletes.csv, events.csv, medals.csv, schedule.csv) and joined using Tableau's relationship modeling features.
💻 Dashboard Creation Process
- Layout Strategy: Divided the dashboard into three logical sections: medal analytics, gender-wise performance, and daily event trends.
- Interactivity: Enabled drill-down filters by country and gender, allowing users to dynamically explore medal standings.
- Design Choices: Used clean, Olympic-themed color schemes with intuitive chart types (e.g., donut charts, bar graphs, Gantt-like schedules).
- Calculated Fields: Applied calculated fields to derive gender ratios, medal totals, and day-wise intensities for better storytelling.
- Navigation: Created a multi-page experience using Tableau Story to guide users from overall trends to detailed event breakdowns.
🎯 Objectives
- Design an Olympic dashboard with interactivity and storytelling as core principles.
- Translate raw Olympic datasets into a visual narrative for real-time analysis.
- Demonstrate Tableau capabilities through filters, calculated fields, relationships, and dynamic charts.
- Empower users to answer key performance and scheduling questions on their own through visuals.
🧮 Skills Used
| Category | Tools & Technologies | Purpose |
|---|---|---|
| Data Visualization | Tableau | Dashboard creation, trend analysis |
| Data Cleaning | Tableau Prep / Excel | Joining and filtering CSV files |
| Data Sources | athletes.csv, events.csv, medals.csv, schedule.csv | Olympic medal and event data |
| Insights | Calculated Fields, Filters | Used to derive KPIs and slice views |